Business Analysis Report
One of the key benefits of the Triaster business improvement platform is that you can use it to model your organisation, simulate changes and predict the performance of the changed processes to find the most effective. This complements the wider process approach to running an organisation.
In this article I set out the four steps involved in producing a quantified business case for process improvement, based on the outcome of a simulation analysis of the As-Is process, when compared with one or more variants (its "To-Be's").
Process Improvement
The overall process of change is illustrated below: some process exists that transforms an Input to an Output. In Version 1 of the process, this transformation takes 8 days and costs £14,000. Through business analysis, an improved process is developed, Version 2, and this costs £3,000 less and completes 1 day sooner.
| Version | Input | Output | Cost | Time |
|---|---|---|---|---|
| Version 1 | INPUT | OUTPUT | £14,000 | 8 days |
| Version 2 | INPUT | OUTPUT | £3,000 less | 1 day sooner |
With Triaster, this improvement happens in four distinct steps:
- Version one is mapped out and ring-fenced into a specific Business Analysis library so the analysis, which might involve sensitive data, can be performed discreetly. The metrics model for the process is defined and attached to the process.
- A Triaster Data Manager is created to enable easy updates of the basic performance data.
- The Triaster simulation engine is used to estimate the value of all quantitative metrics such as Cost, Time and Effort.
- Version one is baselined and referred to as the "As-Is", and then cloned into a specific site for Version two and as many other variants as the business analyst needs. These variants are referred to as the "To-Be's". Each of the To-Be's is simulated, and its performance compared with the As-Is. This is then used as the basis for a quantified business case for change.
Step One: Create a Business Analysis Library
The first step is to clone your existing process library into a 'fenced-off area' where you can carry out simulation and analysis without modifying live processes. This is now considered in detail.
So that you can walk through the steps in this article, Triaster have an on-line demonstration library: AlphaChoco Library. This library was put together for the World Quality Day celebrations in 2015 and is a hypothetical company with supply chain issues in the Chocolate industry.
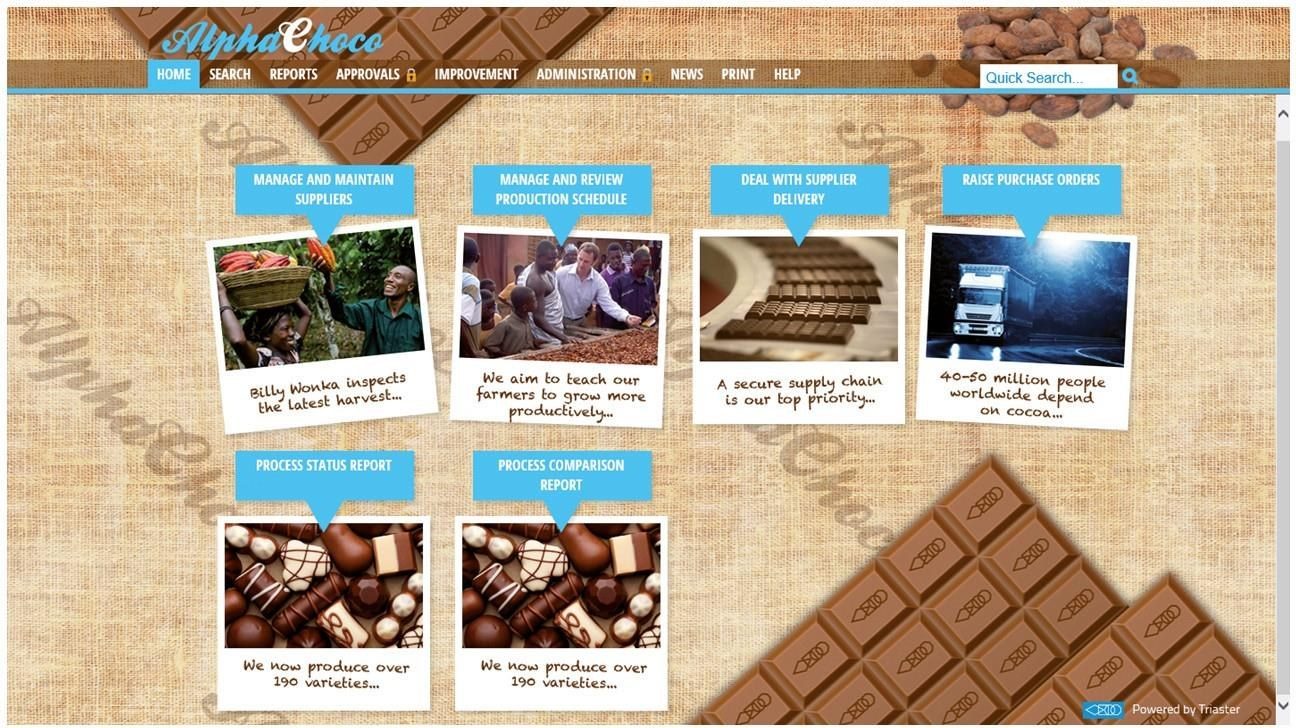
However, it will work much better if you are able to clone a library on your own server. If you would like to obtain the actual maps that are used in this example, please e-mail me personally (michael.cousins@triaster.co.uk) and I will supply them for you.
We have two choices, we can either clone the whole library including its Live, Draft and Sandpit sites, or we can create a new site within the library. It really doesn't matter at this stage which we go for, but I shall clone the whole library in this article.
To do this, log into the Administration tool, click on Library Explorer at the left of the screen, and then select the library you wish to clone (in my case ProcessLibrary).
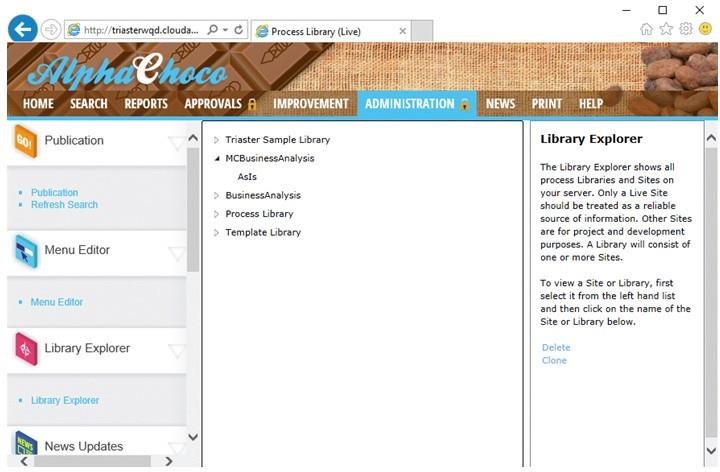
The Triaster platform enables a whole team of Business Analysts to work independently on their own end-to-end process improvement projects, so the proposed naming convention for the cloned library is a name identifier (my initials in this case) followed by "BusinessAnalysis". This convention is not compulsory however and you may choose whatever works best for you.
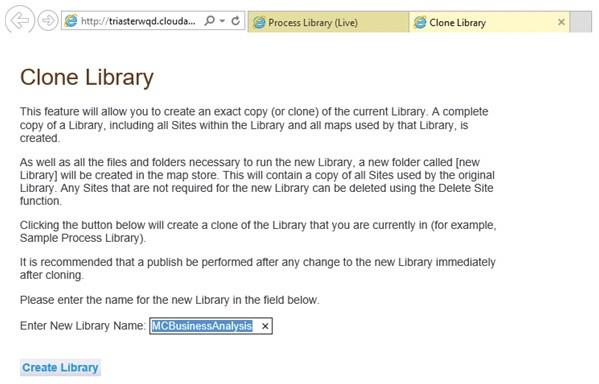
After you click Create Library, the product will:
- Copy the process maps from the current Library into a new folder in the Map Store.
- Create the web pages and menu structure of the new Library itself.
Once you have received the email notification that the library has been cloned, the Library Explorer will contain the new Library, MCBusinessAnalysis.
Unless somebody is an Administrator (or happens to know the name of the library you have created), there is no way a person can get to your library from the interface. Therefore, any changes you make to the maps in this environment are for your eyes only. And because you are working on a copy of the maps, you will not inadvertently change the live library.
It also means that you can freely delete maps and sites from the library that you are uninterested in.
So, using the Library Explorer again, the Live site can be cloned to "AsIs", and then the Live, Sandpit and Draft sites within MCBusinessAnalysis can be deleted along with the corresponding Map Stores.
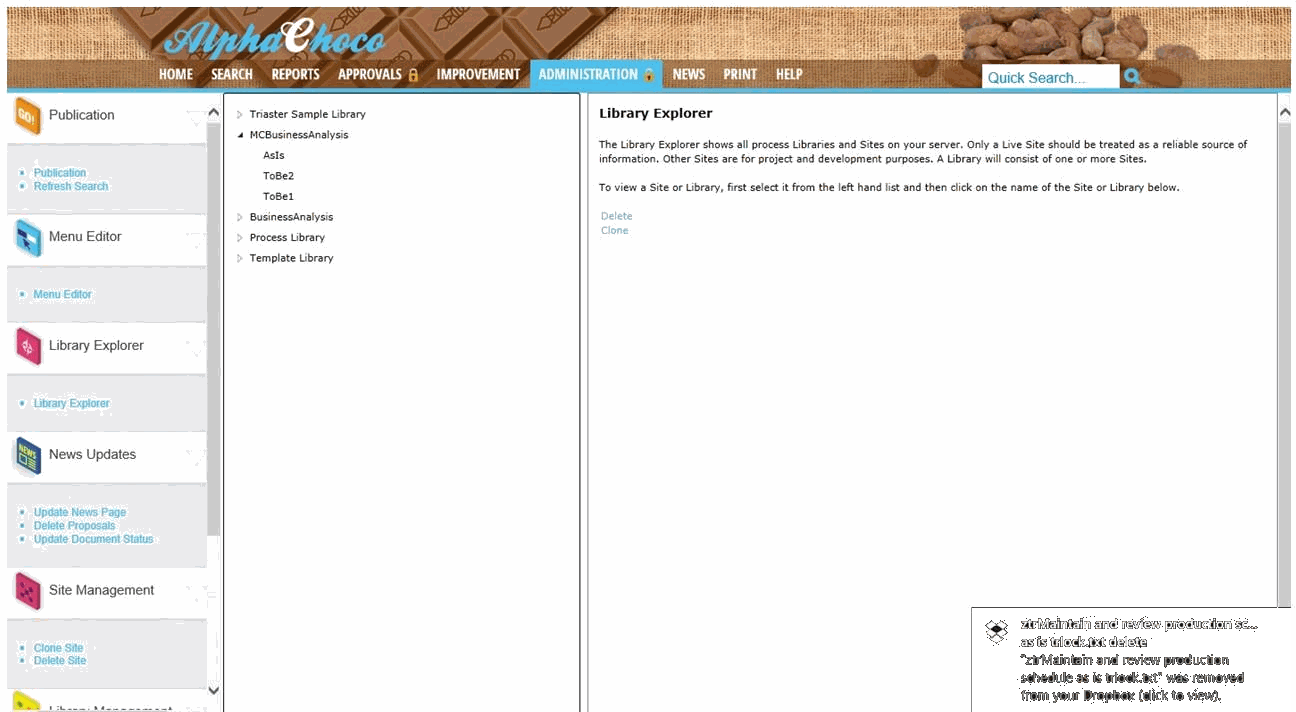
For Business Analysis purposes, the naming convention is to create a baseline As-Is process in a site called AsIs, and then for each To-Be, create a site called ToBe1, ToBe2 etc. The string "AsIs" must be at the start of the AsIs site for the automated comparison reports to work, any name can be used for the To-Be's each site.
Open the AsIs site, and perform a publish to ensure you are viewing the most recent maps in the Library.
To attach a meta-data model to the process in the site is an advanced topic requiring detailed knowledge of Triaster's Properties.xml, Process Metrics.xml and Visio's custom formulae. An overview of required actions is explained here, and the technical detail of the implementation steps are omitted.
When using the simulation features in Triaster, certain Activity (and therefore Node) properties are reserved for system use. These are referred to as System Properties.
Visio custom formulae can be used to define System Properties, and this gives a very powerful, very rich modelling capability. For example, Cost can be redefined to include costs of postage and telephone calls if this is required in your model, and entirely new calculated fields can be added to the meta-model.
The default Activity System Properties are contained in the sections Business Analysis, Non Conformances and Triaster Calculated Process Metrics as shown below:
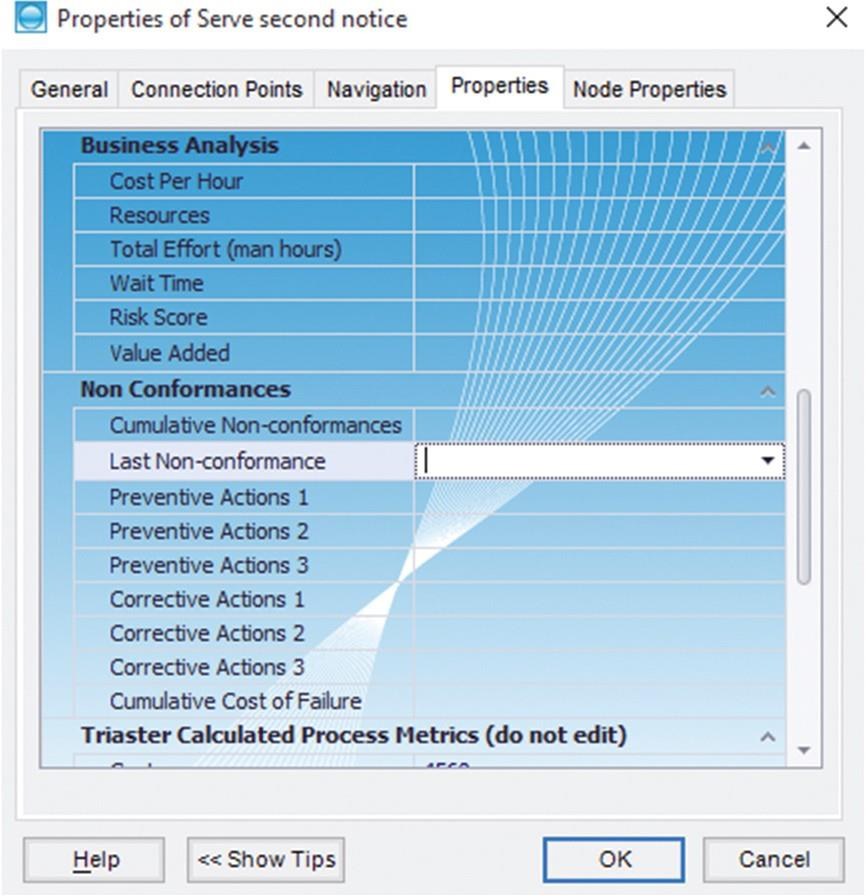
Note that some of the default System Properties are calculated, for example "Cost" is defined as "Cost per Hour * Total Effort".
The value of calculated properties need never be entered directly, rather the values of the referenced properties should be entered.
The Deliverable object also has default Simulation System Properties in the Simulation section shown below:
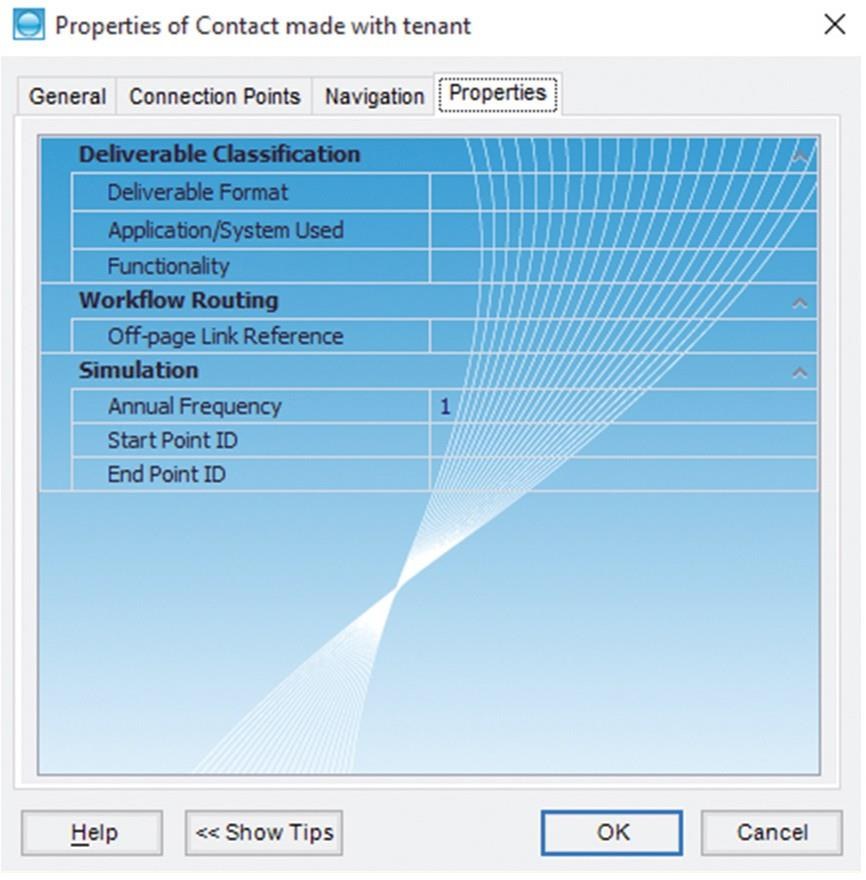
There are 2 main considerations for using System Properties:
- Define and standardise units of measurement (typically for time) and adjust Process Metrics.xml as appropriate.
- Identify and define changes to the System Properties themselves. For example, does Cost include items such as supplier fees, or is it just internal costs? Does time include "down-time" or just processing time?
Once defined, adjust Process Metrics.xml (if implementation requires custom formulae). Any adjustments to the default set of System Properties are encoded in Process Metrics.xml and these will override the behaviour of the default System Properties and replace any conflicting definition in Properties.xml.
That completes the first step towards quantifying the benefit of Process Improvement.
Step two: Create a Triaster Data Manager
Having set up a work area where the maps we need to analyse can be safely modified and published, the second step is to create a Data Manager so we can easily modify the data. Using Process Navigator, attach to the maps and create a new Data Manager with all of the files selected:
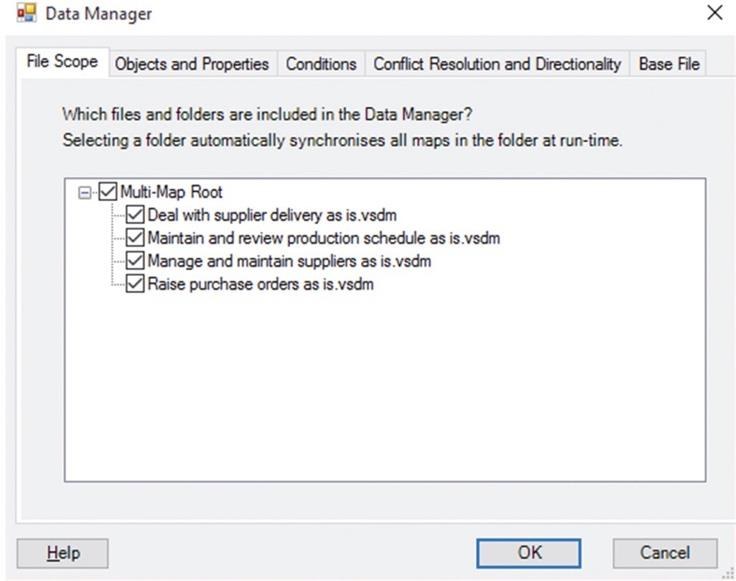
For the purposes of this exercise, it is solely the Cost property we are interested in (which is calculated), so I am only going to select Cost Per Hour and Total Effort on the Objects and Properties tab.
As the plan is to let the Triaster software simulate the process and automatically aggregate the data, it is only the seabed Activities for which I want to maintain the data.
And finally the conflict resolution can be set to the options shown by the image below:
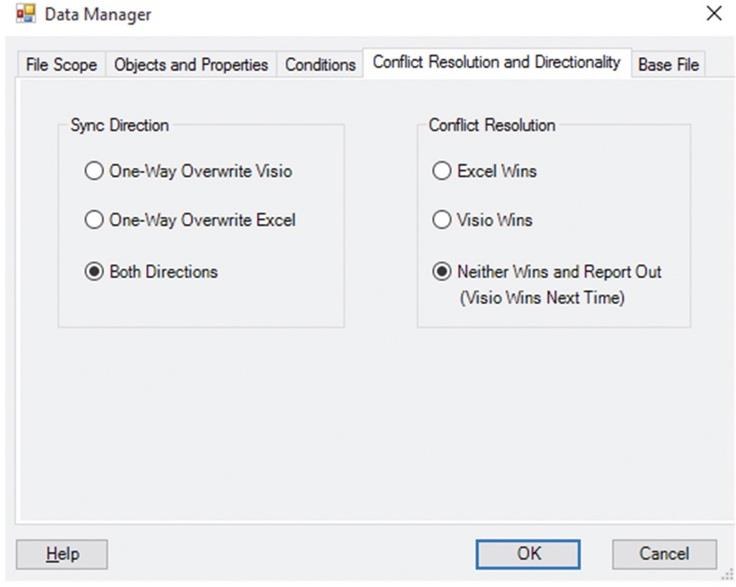
This will set-up for me a two-way sync with Excel that will enable me to experiment with different values in my seabed Activities as I design a new end-to-end 'to-be' process.
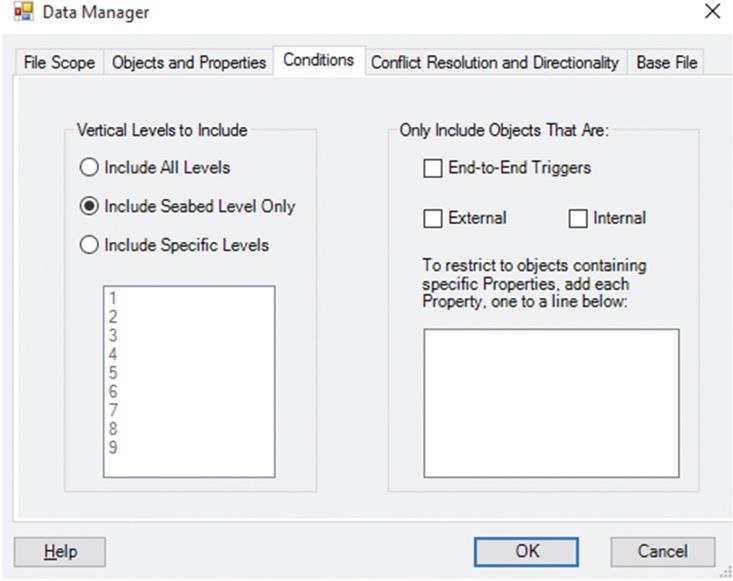
The seabed objects define the vertical levels to include, so the Data Manager settings restrict inclusion to the Seabed Level Only:
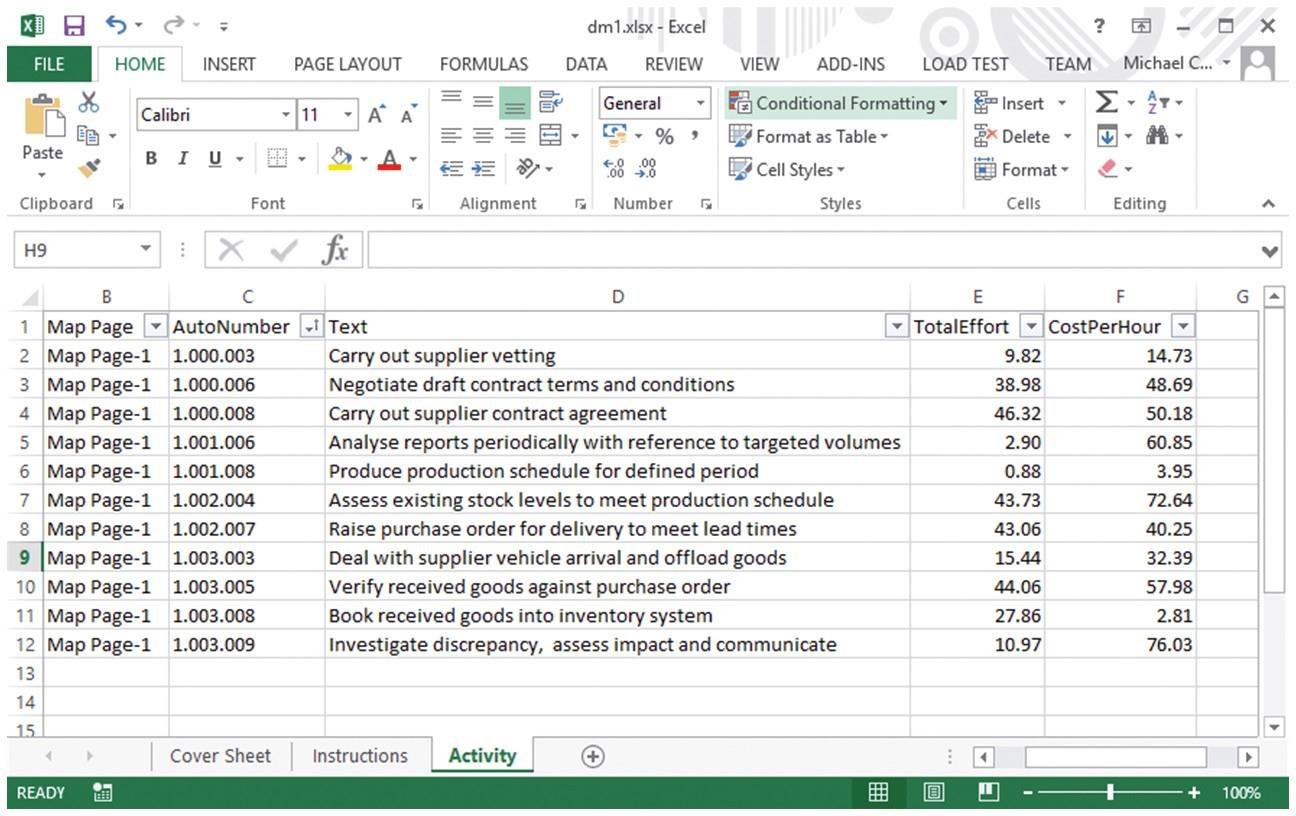
From this Data Manager appropriate values can be entered to give a baseline on the process (I have used random values in this example). Once these values are synchronised into the maps you are able to estimate process performance through process simulation.
Step three: Simulate and baseline the As-Is process
Now we can simulate the process to get an indication of the overall end-to-end cost. In order to do this, back in Process Navigator, press CTRL+L to load all maps, then Multi-Map > Generate Process Metrics.
The simulation will automatically aggregate the data off the seabed into the higher level maps, taking into account the likelihood of occurrence of each Activity in the process.
The simulation produces two standard output files that by default are stored in \My Documents\Process Navigator\Process Metrics. These are:
- PSR.pdf and PSR.docx (PSR short for Process Status Report), a detailed report containing the following sections for each end-to-end process:
- End-to-End Process Components
- Cost, Time, Effort, Resources & Lean Six Sigma
- Referenced Documents, External Hyperlinks and E-mail Links
- Risks
- Non-Conformances
- Cost Detail Breakdown
- Value Stream Analysis
- Execution Checklist
- Improvement Opportunities
- How Triaster View Your Maps as Pathways
- Metrics Model.xlsx, a compiled spreadsheet model providing a comparison of each end-to-end process in the library with the aggregable metrics.
To see the content of a sample PSR, click "Home" in the Process Library and the report is the bottom left link (the Process Self Reliance link on the AlphaChoco home page).
In addition, for every end-to-end process, there is a detailed Microsoft Excel file produced showing the 50 most frequently executed pathways through the end-to-end process and all of the metrics associated with each pathway.
At this stage, you have:
- Isolated out a Business Analysis library to analyse the recruitment process, and attached a meta-model
- Baselined the As-Is in a specific site
- Attached data to the seabed corresponding to the unit costs of each seabed activity
- Synchronised the data back into the maps
- Simulated the process
- Generated the first set of standard reports
Your brief is to reduce the cost, so the next step is to examine alternative versions of this process to see if a more cost-effective process can be produced.
Step four: Produce a business case for improvement
To analyse the process and reduce its cost, let's create a site for each variant of the process we want to look at. It is very similar to the step used earlier to clone the library, but this time we are going to clone the AsIs site itself to make a new site within this library.
I'll call it ToBe1, and following the clone the Library Explorer will show the new site alongside AsIs.
Clearly, by making repeated clones of the Live site, several "to-be's" of the same process can be developed, simulated and compared one with the other.
With the ToBe sites cloned, any changes to the process maps in these sites will update the PSR of that site.
In addition, the simulation engine automatically creates a PCR.pdf (Process Comparison Report) for you which tabulates a comparison of each process in the As-Is site compared with the corresponding process in each of the To-Be sites.
To produce the PCR:
- Attach to the Multi-Map Root which is the container folder for all the sites. For example, if there is a library called "Business Analysis" containing "Maps for As-Is", "Maps for To-Be1" and "Maps for To-Be2", attach to "Business Analysis".
- Select Multi-Map > Generate As-Is to To-Be Report.
Triaster will then attach to each site in turn, perform a simulation, and finally produce the comparison report. An example excerpt is shown below:
Cost, Cost of Failure, Time, Effort and Resources
| As-Is | To-Be-1 | To-Be-2 | |
|---|---|---|---|
| Cost | £1,522.28 | £1,042.20 | £2,609.80 |
| Cost Of Failure | £17,700.00 | £0.00 | £0.00 |
| Cycle Time | 241.50 | 156.45 | 385.20 |
| Total Effort | 50.70 | 35.05 | 86.50 |
| Resources | 6.40 | 6.40 | 13.40 |
Lean 6 Sigma
| As-Is | To-Be-1 | To-Be-2 | |
|---|---|---|---|
| Cycle Time | 241.50 | 156.45 | 385.20 |
| Value Added | 25.35 | 13.90 | 39.05 |
| Non-Value Added | 49.20 | 40.80 | 101.00 |
| Necessary Non-Value Added | 166.95 | 77.15 | 171.35 |
| Process Cycle Efficiency | 10.50% | 8.88% | 10.14% |
Costed Business Case for Change
| As-Is | To-Be-1 | To-Be-2 | |
|---|---|---|---|
| Cost (per process execution) | £1,522.28 | £1,042.20 | £2,609.80 |
| Annual Cost | £22,834.20 | £15,633.00 | £39,147.00 |
| Annual Cost of Failure | £17,700.00 | £0.00 | £0.00 |
| Total Annual Cost | £40,534.20 | £15,633.00 | £39,147.00 |
A sample PCR report is also available from the Home page of the example library.
In conclusion
This series of articles has shown how, using multiple libraries and sites, data managers and the Triaster simulation engine, it is possible to build a business case for change and allow stakeholders and managers to view the detail of the as-is and to-be process. This approach sits alongside our wider guidance on business process mapping and QMS consulting services.
Several significant enhancements of the Triaster simulation engine are underway and I look forward to sharing these with you in future.
Michael Cousins
Triaster